 Web Server Statistics for ritalinkopen.online
Program started on Mon, May 18 2026 at 8:08 PM.
Analyzed requests from Tue, Nov 12 2024 at 11:20 PM to Mon, May 18 2026 at 7:39 PM (551.85 days).
Web Server Statistics for ritalinkopen.onlineProgram started on Mon, May 18 2026 at 8:08 PM.
Analyzed requests from Tue, Nov 12 2024 at 11:20 PM to Mon, May 18 2026 at 7:39 PM (551.85 days).
(Go To: Top | General Summary | Monthly Report | Daily Summary | Hourly Summary | Domain Report | Organization Report | Browser Report | Browser Summary | Operating System Report | Status Code Report | File Size Report | File Type Report | Directory Report | Request Report)
Figures in parentheses refer to the 7-day period ending May 18 2026 at 8:08 PM.
Successful requests: 16,408 (280)
Average successful requests per day: 29 (39)
Successful requests for pages: 1 (0)
Failed requests: 15,159 (40)
Redirected requests: 6,151 (0)
Distinct files requested: 16,270 (31,438)
Distinct hosts served: 1,931 (3,554)
Data transferred: 1.03 megabytes (17.50 kilobytes)
Average data transferred per day: 1.91 kilobytes (2.50 kilobytes)
(Go To: Top | General Summary | Monthly Report | Daily Summary | Hourly Summary | Domain Report | Organization Report | Browser Report | Browser Summary | Operating System Report | Status Code Report | File Size Report | File Type Report | Directory Report | Request Report)
Each unit ( ) represents 1 request for a page.
| month | #reqs | #pages | |
|---|---|---|---|
| Nov 2024 | 739 | 0 | |
| Dec 2024 | 1210 | 0 | |
| Jan 2025 | 1265 | 0 | |
| Feb 2025 | 1118 | 0 | |
| Mar 2025 | 1264 | 0 | |
| Apr 2025 | 1200 | 0 | |
| May 2025 | 1265 | 0 | |
| Jun 2025 | 1201 | 1 | |
| Jul 2025 | 1265 | 0 | |
| Aug 2025 | 1240 | 0 | |
| Sep 2025 | 1225 | 0 | |
| Oct 2025 | 1240 | 0 | |
| Nov 2025 | 1221 | 0 | |
| Dec 2025 | 355 | 0 | |
| Jan 2026 | 0 | 0 | |
| Feb 2026 | 0 | 0 | |
| Mar 2026 | 0 | 0 | |
| Apr 2026 | 0 | 0 | |
| May 2026 | 600 | 0 |
Busiest month: Jun 2025 (1 request for a page).
(Go To: Top | General Summary | Monthly Report | Daily Summary | Hourly Summary | Domain Report | Organization Report | Browser Report | Browser Summary | Operating System Report | Status Code Report | File Size Report | File Type Report | Directory Report | Request Report)
Each unit () represents 1 request for a page.
| day | #reqs | #pages | |
|---|---|---|---|
| Sun | 2346 | 1 | |
| Mon | 2355 | 0 | |
| Tue | 2360 | 0 | |
| Wed | 2320 | 0 | |
| Thu | 2343 | 0 | |
| Fri | 2340 | 0 | |
| Sat | 2344 | 0 |
(Go To: Top | General Summary | Monthly Report | Daily Summary | Hourly Summary | Domain Report | Organization Report | Browser Report | Browser Summary | Operating System Report | Status Code Report | File Size Report | File Type Report | Directory Report | Request Report)
Each unit () represents 1 request for a page.
| hour | #reqs | #pages | |
|---|---|---|---|
| 0 | 0 | 0 | |
| 1 | 1930 | 0 | |
| 2 | 100 | 0 | |
| 3 | 1 | 1 | |
| 4 | 1930 | 0 | |
| 5 | 95 | 0 | |
| 6 | 0 | 0 | |
| 7 | 2089 | 0 | |
| 8 | 100 | 0 | |
| 9 | 0 | 0 | |
| 10 | 1935 | 0 | |
| 11 | 100 | 0 | |
| 12 | 0 | 0 | |
| 13 | 1935 | 0 | |
| 14 | 90 | 0 | |
| 15 | 0 | 0 | |
| 16 | 1935 | 0 | |
| 17 | 95 | 0 | |
| 18 | 0 | 0 | |
| 19 | 1931 | 0 | |
| 20 | 95 | 0 | |
| 21 | 0 | 0 | |
| 22 | 1928 | 0 | |
| 23 | 119 | 0 |
(Go To: Top | General Summary | Monthly Report | Daily Summary | Hourly Summary | Domain Report | Organization Report | Browser Report | Browser Summary | Operating System Report | Status Code Report | File Size Report | File Type Report | Directory Report | Request Report)
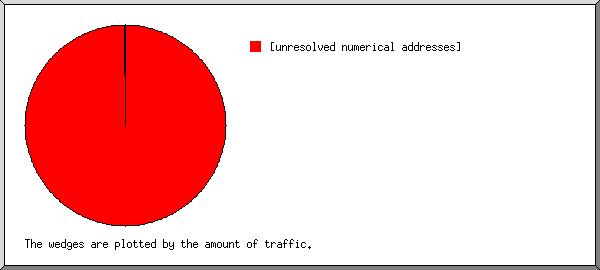
Listing domains, sorted by the amount of traffic.
| #reqs | %bytes | domain |
|---|---|---|
| 16394 | 99.89% | [unresolved numerical addresses] |
| 14 | 0.11% | [domain not given] |
(Go To: Top | General Summary | Monthly Report | Daily Summary | Hourly Summary | Domain Report | Organization Report | Browser Report | Browser Summary | Operating System Report | Status Code Report | File Size Report | File Type Report | Directory Report | Request Report)
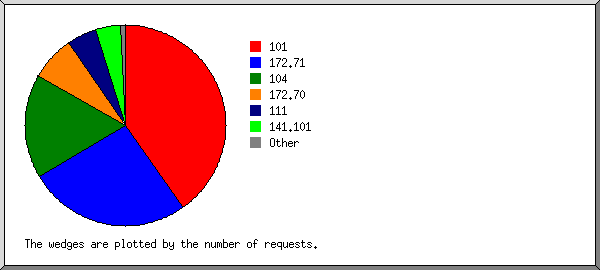
Listing organizations, sorted by the number of requests.
| #reqs | %bytes | organization |
|---|---|---|
| 6605 | 39.29% | 101 |
| 4281 | 27.74% | 172.71 |
| 2759 | 16.40% | 104 |
| 1209 | 7.19% | 172.70 |
| 780 | 4.65% | 111 |
| 658 | 3.90% | 141.101 |
| 48 | 0.28% | 162.159 |
| 32 | 0.26% | 172.68 |
| 14 | 0.11% | [domain not given] |
| 11 | 0.09% | 162.158 |
| 8 | 0.06% | 172.69 |
| 2 | 0.02% | 172.64 |
| 1 | 0.01% | 108 |
(Go To: Top | General Summary | Monthly Report | Daily Summary | Hourly Summary | Domain Report | Organization Report | Browser Report | Browser Summary | Operating System Report | Status Code Report | File Size Report | File Type Report | Directory Report | Request Report)
Listing browsers with at least 1 request for a page, sorted by the number of requests for pages.
| #reqs | #pages | browser |
|---|---|---|
| 1 | 1 | Cloudflare-SSLDetector |
| 16407 | 0 | [not listed: 2 browsers] |
(Go To: Top | General Summary | Monthly Report | Daily Summary | Hourly Summary | Domain Report | Organization Report | Browser Report | Browser Summary | Operating System Report | Status Code Report | File Size Report | File Type Report | Directory Report | Request Report)
Listing browsers with at least 1 request for a page, sorted by the number of requests for pages.
| # | #reqs | #pages | browser |
|---|---|---|---|
| 1 | 1 | 1 | Cloudflare-SSLDetector |
| 16407 | 0 | [not listed: 2 browsers] |
(Go To: Top | General Summary | Monthly Report | Daily Summary | Hourly Summary | Domain Report | Organization Report | Browser Report | Browser Summary | Operating System Report | Status Code Report | File Size Report | File Type Report | Directory Report | Request Report)
Listing operating systems, sorted by the number of requests for pages.
| # | #reqs | #pages | OS |
|---|---|---|---|
| 1 | 16408 | 1 | OS unknown |
(Go To: Top | General Summary | Monthly Report | Daily Summary | Hourly Summary | Domain Report | Organization Report | Browser Report | Browser Summary | Operating System Report | Status Code Report | File Size Report | File Type Report | Directory Report | Request Report)
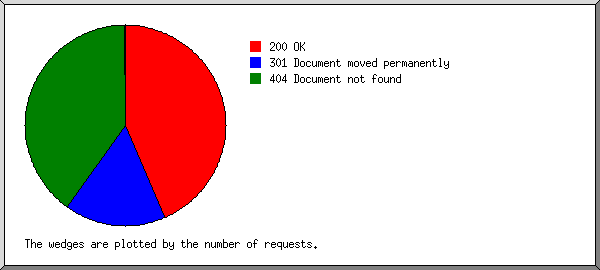
Listing status codes, sorted numerically.
| #reqs | status code |
|---|---|
| 16408 | 200 OK |
| 6148 | 301 Document moved permanently |
| 3 | 302 Document found elsewhere |
| 8 | 403 Access forbidden |
| 15148 | 404 Document not found |
| 3 | 500 Internal server error |
(Go To: Top | General Summary | Monthly Report | Daily Summary | Hourly Summary | Domain Report | Organization Report | Browser Report | Browser Summary | Operating System Report | Status Code Report | File Size Report | File Type Report | Directory Report | Request Report)

| size | #reqs | %bytes |
|---|---|---|
| 0 | 0 | |
| 1B- 10B | 0 | |
| 11B- 100B | 16407 | 97.64% |
| 101B- 1kB | 0 | |
| 1kB- 10kB | 0 | |
| 10kB-100kB | 1 | 2.36% |
(Go To: Top | General Summary | Monthly Report | Daily Summary | Hourly Summary | Domain Report | Organization Report | Browser Report | Browser Summary | Operating System Report | Status Code Report | File Size Report | File Type Report | Directory Report | Request Report)
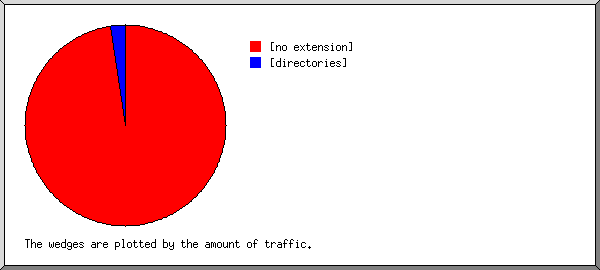
Listing extensions with at least 0.1% of the traffic, sorted by the amount of traffic.
| #reqs | %bytes | extension |
|---|---|---|
| 16407 | 97.64% | [no extension] |
| 1 | 2.36% | [directories] |
(Go To: Top | General Summary | Monthly Report | Daily Summary | Hourly Summary | Domain Report | Organization Report | Browser Report | Browser Summary | Operating System Report | Status Code Report | File Size Report | File Type Report | Directory Report | Request Report)

Listing directories with at least 0.01% of the traffic, sorted by the amount of traffic.
| #reqs | %bytes | directory |
|---|---|---|
| 16407 | 97.64% | /.well-known/ |
| 1 | 2.36% | [root directory] |
(Go To: Top | General Summary | Monthly Report | Daily Summary | Hourly Summary | Domain Report | Organization Report | Browser Report | Browser Summary | Operating System Report | Status Code Report | File Size Report | File Type Report | Directory Report | Request Report)
Listing files with at least 20 requests, sorted by the number of requests.
| #reqs | %bytes | last time | file |
|---|---|---|---|
| 16408 | 100% | May/18/26 7:39 PM | [not listed: 16,270 files] |